Case study: hotel stays
This case study illustrates the use of the staircase package to analyse data pertaining to bookings at a hotel. The data is adapted from the Hotel Booking Demand dataset available on Kaggle.
[1]:
import pandas as pd
import matplotlib.pyplot as plt
import matplotlib.ticker as ticker
from pandas.plotting import register_matplotlib_converters
register_matplotlib_converters()
import seaborn as sns

import staircase as sc
We begin by importing the data using the pandas library, and take the opportunity to specify which columns of the resulting dataframe should be interpreted as dates, and which should be interpreted as categorical.
[2]:
data = pd.read_csv('./data/hotel_stays.csv', parse_dates=["check_in", "check_out"], dtype={"reserved_room_type":"category", "assigned_room_type":"category"})
data
/home/docs/checkouts/readthedocs.org/user_builds/railing/envs/v1.6.4/lib/python3.8/site-packages/ipykernel/ipkernel.py:283: DeprecationWarning: `should_run_async` will not call `transform_cell` automatically in the future. Please pass the result to `transformed_cell` argument and any exception that happen during thetransform in `preprocessing_exc_tuple` in IPython 7.17 and above.
  and should_run_async(code)
[2]:
| check_in | check_out | adults | children | reserved_room_type | assigned_room_type | |
|---|---|---|---|---|---|---|
| 0 | 2015-12-08 15:33:00 | 2016-01-05 09:56:00 | 2 | 0 | E | E |
| 1 | 2015-12-17 14:19:00 | 2016-01-05 09:04:00 | 2 | 0 | E | E |
| 2 | 2015-12-23 14:02:00 | 2016-01-02 06:58:00 | 2 | 0 | E | E |
| 3 | 2015-12-24 15:54:00 | 2016-01-01 08:48:00 | 2 | 0 | D | D |
| 4 | 2015-12-26 15:33:00 | 2016-01-01 09:59:00 | 2 | 2 | G | G |
| ... | ... | ... | ... | ... | ... | ... |
| 13597 | 2016-12-31 16:13:00 | 2017-01-08 09:29:00 | 2 | 0 | A | A |
| 13598 | 2016-12-29 16:38:00 | 2017-01-09 10:28:00 | 2 | 0 | A | A |
| 13599 | 2016-12-13 17:32:00 | 2017-01-10 09:30:00 | 2 | 0 | E | E |
| 13600 | 2016-12-29 15:42:00 | 2017-01-12 08:48:00 | 2 | 0 | A | A |
| 13601 | 2016-12-17 14:10:00 | 2017-01-14 05:48:00 | 2 | 0 | D | D |
13602 rows × 6 columns
We will be interested in performing some analysis based on assigned room types. The following code produces a pandas.Series instance, indexed by the various room types. The values of this series are staircase.Stairs instances, each representing the number of rooms occupied over time.
[3]:
assigned_room_type_stairs = data.groupby(["assigned_room_type"]).apply(lambda df: sc.Stairs(use_dates=True).layer(df.check_in, df.check_out))
assigned_room_type_stairs
/home/docs/checkouts/readthedocs.org/user_builds/railing/envs/v1.6.4/lib/python3.8/site-packages/ipykernel/ipkernel.py:283: DeprecationWarning: `should_run_async` will not call `transform_cell` automatically in the future. Please pass the result to `transformed_cell` argument and any exception that happen during thetransform in `preprocessing_exc_tuple` in IPython 7.17 and above.
  and should_run_async(code)
[3]:
assigned_room_type
A    <staircase.Stairs, id=139784286577376, dates=T...
B    <staircase.Stairs, id=139784286805152, dates=T...
C    <staircase.Stairs, id=139784286580304, dates=T...
D    <staircase.Stairs, id=139784286576848, dates=T...
E    <staircase.Stairs, id=139784286576896, dates=T...
F    <staircase.Stairs, id=139784286579776, dates=T...
G    <staircase.Stairs, id=139785179783232, dates=T...
H    <staircase.Stairs, id=139785179754064, dates=T...
I    <staircase.Stairs, id=139784286579728, dates=T...
dtype: object
It will be useful to keep a reference of the possible room types which can be assigned…
[4]:
assigned_room_types = list(assigned_room_type_stairs.index)
assigned_room_types
[4]:
['A', 'B', 'C', 'D', 'E', 'F', 'G', 'H', 'I']
How many rooms assigned over the course of the year?
Let’s start by looking at how many rooms, in total, were occupied over time. The arithmetic operators that belong to the Stairs class are automatically applied when calling their counterparts belonging to the pandas.Series class. For example the code block below adds the Stairs instances for each room type together, to produce a single Stairs instance representing total rooms.
[5]:
all_assigned_stairs = assigned_room_type_stairs.sum()
all_assigned_stairs
[5]:
<staircase.Stairs, id=139784711486288, dates=True, tz=None>
We can make a simple plot to get a quick feel for how the total bookings vary over the course of the year. Plotting with the staircase package is compatible with the matplotlib library (and therefore also seaborn which is built upon matplotlib).*
[6]:
boundary_2016 = (pd.to_datetime('2016'), pd.to_datetime('2017'))

fig, ax = plt.subplots(figsize=(15,8))
all_assigned_stairs.plot(ax)
ax.set_xlim(*boundary_2016);
[6]:
(16801.0, 17167.0)
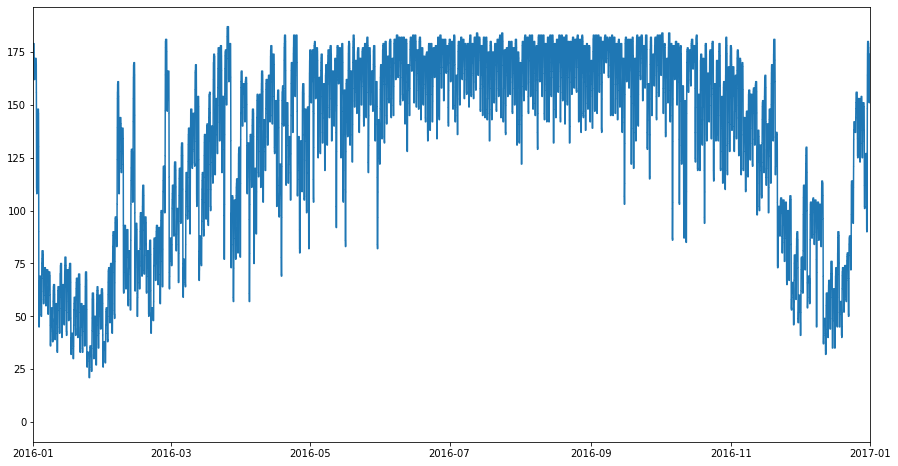
A visual inspection of the graph suggests the hotel probably has approximately 180 rooms. We can check the actual maximum simulteanous bookings observed with the Stairs.max function.
[7]:
all_assigned_stairs.max()
[7]:
187
In the plot above there is a fair bit of noise introduced by the fact that the step function changes value whenever there is a check-in our check-out. We can use the Stairs.resample function to get a step function which tracks the occupancy at midnight of each night, which will give a clearer view of what is going on
[8]:
midnights_2016 = pd.date_range(*boundary_2016, closed='left')
all_assigned_midnight_stairs = all_assigned_stairs.resample(midnights_2016)
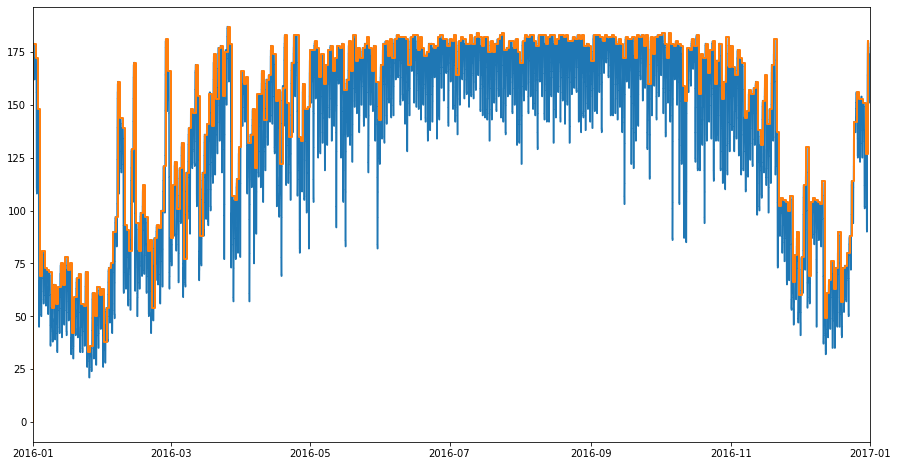
When we plot our resampled Stairs instance, we can see that it traces the maximum of the previous Stairs instance. This is to be expected.
[9]:
fig, ax = plt.subplots(figsize=(15,8))
all_assigned_stairs.plot(ax)
all_assigned_midnight_stairs.plot(ax=ax, linewidth=2);
ax.set_xlim(*boundary_2016);
[9]:
(16801.0, 17167.0)
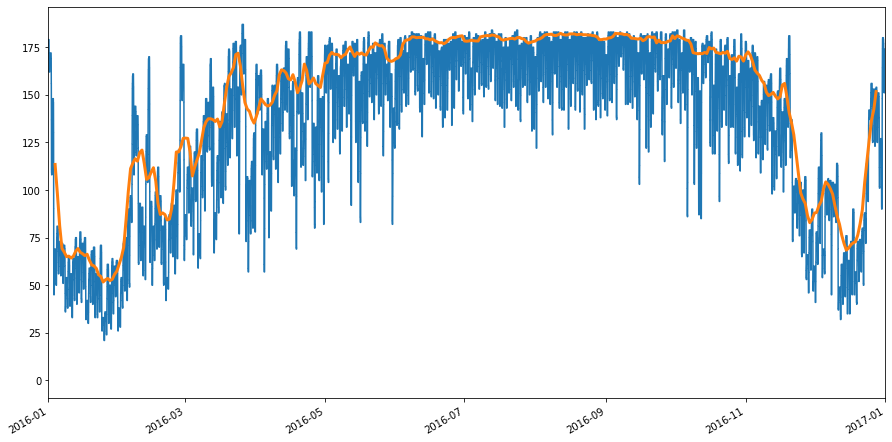
An alternative to the above is to create evaluate the step function at the midnight values, and create a pandas.Series from the results. This method can be used with a rolling window to highlight trend. In the code block below we use a method chain to create such a series, apply a 7 day rolling average and plot the result
[10]:
fig, ax = plt.subplots(figsize=(15,8))
all_assigned_stairs.plot(ax)
(pd.Series(all_assigned_stairs(midnights_2016), index=midnights_2016)
    .rolling(7,center=True).mean()
    .plot(ax=ax, linewidth=3)
)
ax.set_xlim(*boundary_2016);
[10]:
(16801.0, 17167.0)
Let’s now turn our attention to the occupancy of each room type. Recall that assigned_room_type_stairs is a pandas.Series instance, indexed by room type, and whose values are Stairs instances. Let’s plot the occupancy for each room type on the one chart.
[11]:
fig, ax = plt.subplots(figsize=(15,8))
for room_type in assigned_room_types:
    assigned_room_type_stairs[room_type].plot(ax, label=room_type)
ax.set_xlim(*boundary_2016)
ax.legend();
/home/docs/checkouts/readthedocs.org/user_builds/railing/envs/v1.6.4/lib/python3.8/site-packages/ipykernel/ipkernel.py:283: DeprecationWarning: `should_run_async` will not call `transform_cell` automatically in the future. Please pass the result to `transformed_cell` argument and any exception that happen during thetransform in `preprocessing_exc_tuple` in IPython 7.17 and above.
  and should_run_async(code)
[11]:
<matplotlib.legend.Legend at 0x7f220fe2eb80>
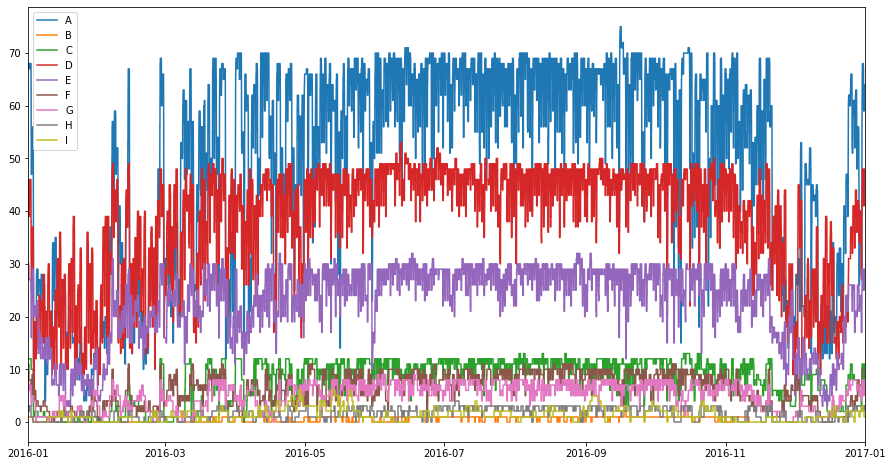
From the plot above we can see that room type A is the most common room in the hotel, followed by room type D, then E, and so on. There are very few rooms of type B, H, and I. Perhaps their rarity suggests they might be penthouse suites, or capable of accommodating large families. If we want to repeat the previous exercise of removing noise, by evaluating the step functions at midnight, we can resample all the Stairs instances using pandas.Series.map and a lambda function
[12]:
assigned_room_type_stairs.map(lambda x: x.resample(midnights_2016))
[12]:
assigned_room_type
A    <staircase.Stairs, id=139784275617872, dates=T...
B    <staircase.Stairs, id=139784275616960, dates=T...
C    <staircase.Stairs, id=139784275617104, dates=T...
D    <staircase.Stairs, id=139784275617296, dates=T...
E    <staircase.Stairs, id=139784280243024, dates=T...
F    <staircase.Stairs, id=139784272099504, dates=T...
G    <staircase.Stairs, id=139784272098160, dates=T...
H    <staircase.Stairs, id=139784275494224, dates=T...
I    <staircase.Stairs, id=139784275496384, dates=T...
dtype: object
Alternatively the staircase package contains a function called sample, which takes a collection of Stairs instances and evaluates them at the values specified. The results are returned as a pandas.DataFrame, in tidy data format.
[13]:
def create_rolling_value(df):
    df.value = df.value.rolling(window=7, center=True).mean()
    return df

sc.sample(assigned_room_type_stairs, midnights_2016).groupby('key').apply(lambda df: df.assign(value = df.value.rolling(window=7, center=True).mean()))
[13]:
| points | key | value | ||
|---|---|---|---|---|
| key | ||||
| A | 0 | 2016-01-01 | A | NaN |
| 1 | 2016-01-02 | A | NaN | |
| 2 | 2016-01-03 | A | NaN | |
| 3 | 2016-01-04 | A | 41.714286 | |
| 4 | 2016-01-05 | A | 35.142857 | |
| ... | ... | ... | ... | ... |
| I | 3289 | 2016-12-27 | I | 1.857143 |
| 3290 | 2016-12-28 | I | 2.000000 | |
| 3291 | 2016-12-29 | I | NaN | |
| 3292 | 2016-12-30 | I | NaN | |
| 3293 | 2016-12-31 | I | NaN |
3294 rows × 3 columns
The seaborn package makes plotting tidy data simple, so we take advantage of this by using the seaborn.lineplot function.
[14]:
fig, ax = plt.subplots(figsize=(15,8))
sns.lineplot(data=sc.sample(assigned_room_type_stairs, midnights_2016), x="points", y="value", hue="key", ax=ax);
/home/docs/checkouts/readthedocs.org/user_builds/railing/envs/v1.6.4/lib/python3.8/site-packages/ipykernel/ipkernel.py:283: DeprecationWarning: `should_run_async` will not call `transform_cell` automatically in the future. Please pass the result to `transformed_cell` argument and any exception that happen during thetransform in `preprocessing_exc_tuple` in IPython 7.17 and above.
  and should_run_async(code)
[14]:
<AxesSubplot:xlabel='points', ylabel='value'>
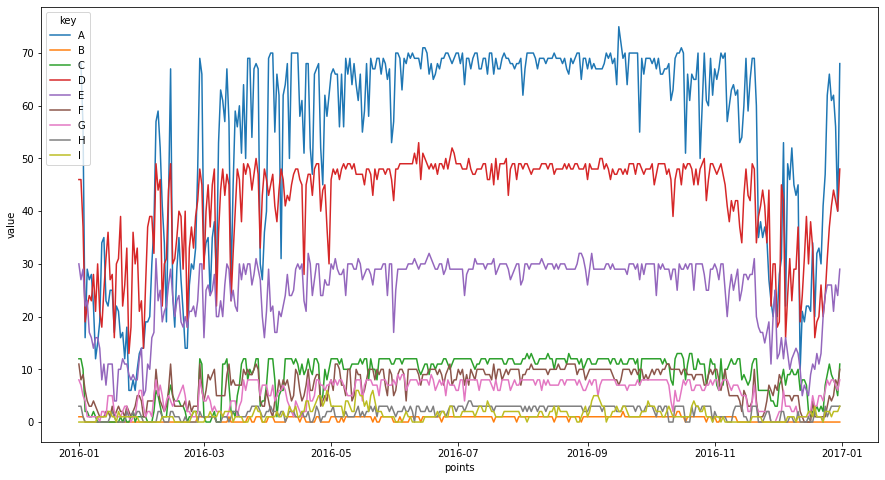
So far we have analysed occupancy from the persepective of room count. Next we demonstrate how the staircase package can easily incorporate the number of guests into the analysis
How many people over the course of the year?
Recall that “data” is the pandas.DataFrame containing the hotel booking data. We proceed as before, however this time when we call the layer function, we weight the booking intervals by the number of people (adults + children) associated with the booking. We create a Stairs instance for each assigned room type but also create a Stairs instance by adding the others together. Finally we create a pandas.Series indexed by the midnight values.
[15]:
people_room_type_stairs = data.groupby(["assigned_room_type"]).apply(lambda df: sc.Stairs(use_dates=True).layer(df.check_in, df.check_out, df.adults+df.children))
people_stairs = people_room_type_stairs.sum()
people_midnight_stairs = people_stairs.resample(midnights_2016)
people_midnight_series = pd.Series(people_stairs(midnights_2016), index=midnights_2016)
/home/docs/checkouts/readthedocs.org/user_builds/railing/envs/v1.6.4/lib/python3.8/site-packages/ipykernel/ipkernel.py:283: DeprecationWarning: `should_run_async` will not call `transform_cell` automatically in the future. Please pass the result to `transformed_cell` argument and any exception that happen during thetransform in `preprocessing_exc_tuple` in IPython 7.17 and above.
  and should_run_async(code)
As before we plot a rolling 7 day average, applied to the step function values, evaluated at midnight
[16]:
fig, ax = plt.subplots(figsize=(15,8))
people_stairs.plot(ax)
people_midnight_series.rolling(7,center=True).mean().plot(ax=ax, linewidth=3)
ax.set_xlim(*boundary_2016);
[16]:
(16801.0, 17167.0)
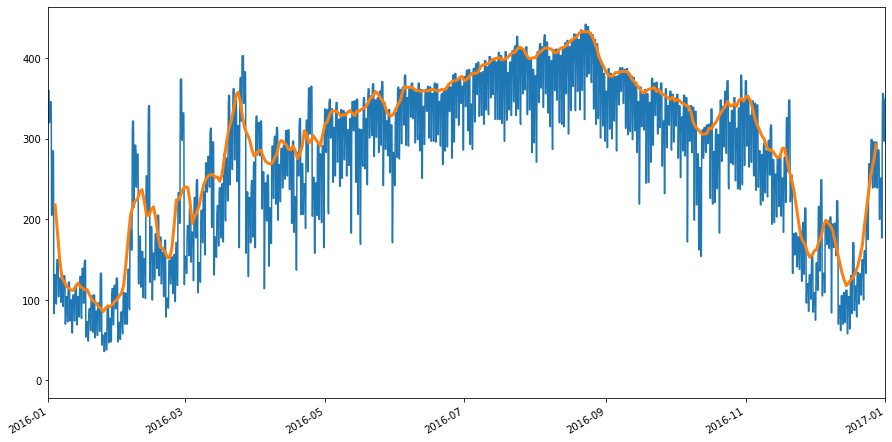
The Stairs class comes with several functions which allow for aggregation of step function values. For example in the following code block we use Stairs instances to calculate
1) The average number of people staying each night, for 2016
2) The average number of rooms occupied each night, for 2016
3) The average number of people per room, for 2016
[17]:
print(people_midnight_stairs.mean(*boundary_2016))
print(all_assigned_midnight_stairs.mean(*boundary_2016))
print(people_midnight_stairs.mean(*boundary_2016)/all_assigned_midnight_stairs.mean(*boundary_2016))
295.4344262295082
147.64207650273224
2.001017821122564
/home/docs/checkouts/readthedocs.org/user_builds/railing/envs/v1.6.4/lib/python3.8/site-packages/ipykernel/ipkernel.py:283: DeprecationWarning: `should_run_async` will not call `transform_cell` automatically in the future. Please pass the result to `transformed_cell` argument and any exception that happen during thetransform in `preprocessing_exc_tuple` in IPython 7.17 and above.
  and should_run_async(code)
So, on average room bookings are made for 2 people. What if we want to know how this value changes over the course of the year? We can do this by utilising arithmetic operators with Stairs instances. In the code block below we apply operations to pandas.Series so that for each assigned room type we divide the step function, representing number of people booked, by the step function representing the number of rooms booked. Note we add a small value of 0.00001 to the divisor to avoid divide by zero errors.
[18]:
people_per_room_type_stairs = (people_room_type_stairs/(assigned_room_type_stairs + sc.Stairs(0.00001, use_dates=True)))
people_per_room_type_stairs
[18]:
assigned_room_type
A    <staircase.Stairs, id=139784275858528, dates=T...
B    <staircase.Stairs, id=139784275858288, dates=T...
C    <staircase.Stairs, id=139784275858144, dates=T...
D    <staircase.Stairs, id=139784275857952, dates=T...
E    <staircase.Stairs, id=139784275858384, dates=T...
F    <staircase.Stairs, id=139784275858864, dates=T...
G    <staircase.Stairs, id=139784278399968, dates=T...
H    <staircase.Stairs, id=139784278400256, dates=T...
I    <staircase.Stairs, id=139784278399536, dates=T...
dtype: object
We then plot each of these Stairs instances on a separate chart.
[19]:
for room_type in people_per_room_type_stairs.index:
    fig, ax = plt.subplots(figsize=(20,8))
    people_per_room_type_stairs[room_type].plot(ax, label=room_type)
    ax.legend()
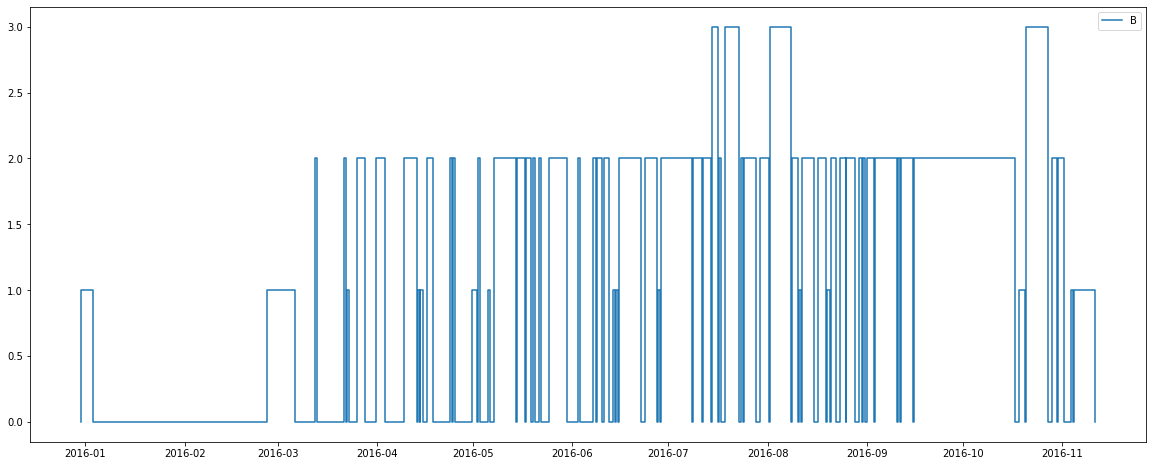
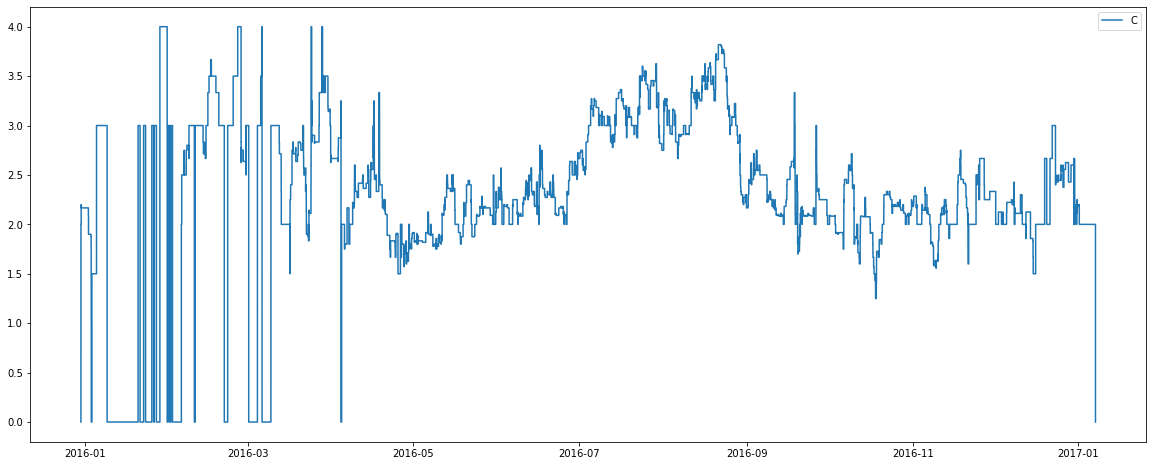
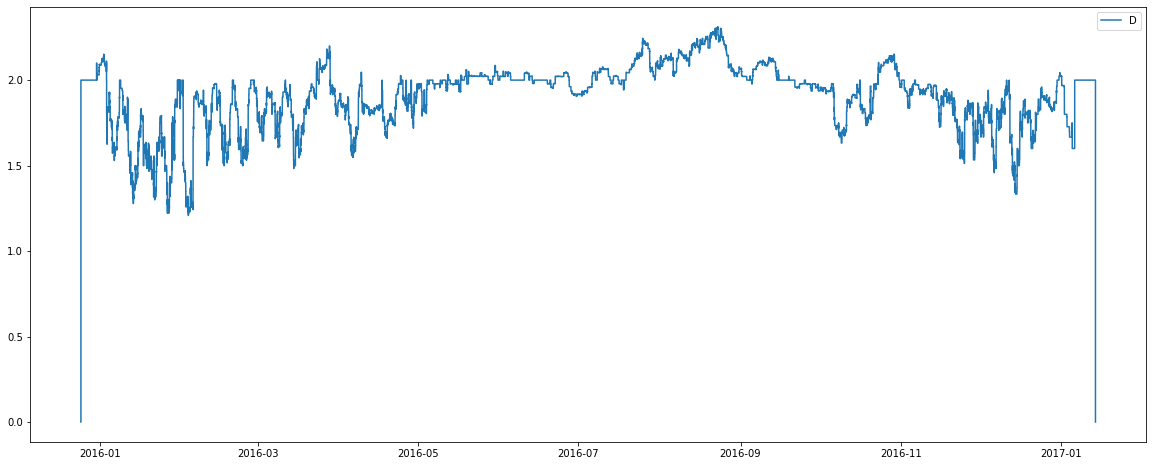
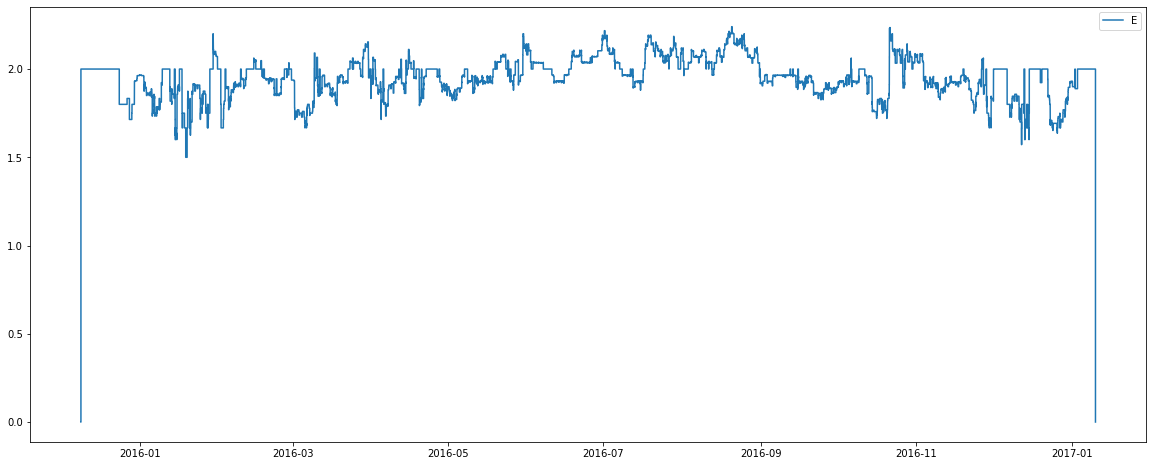
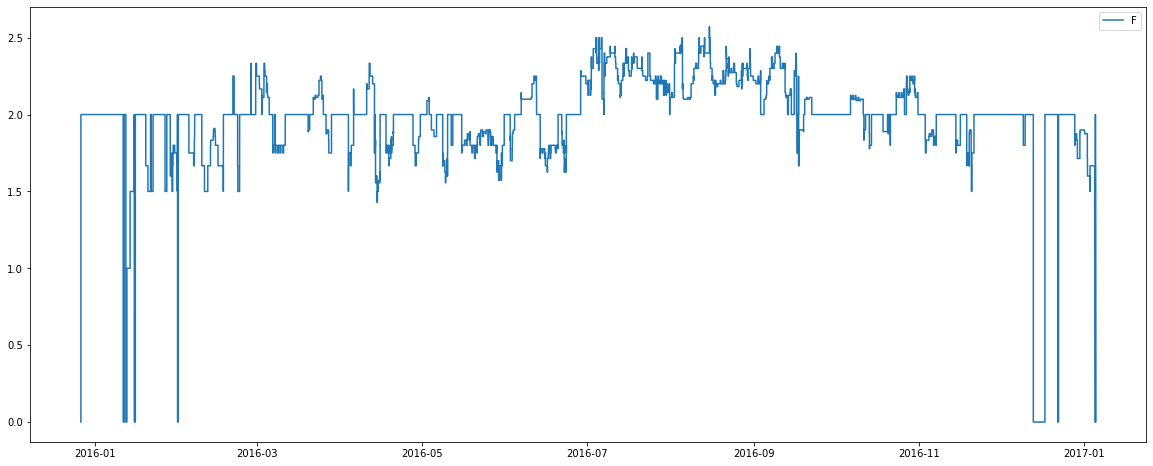
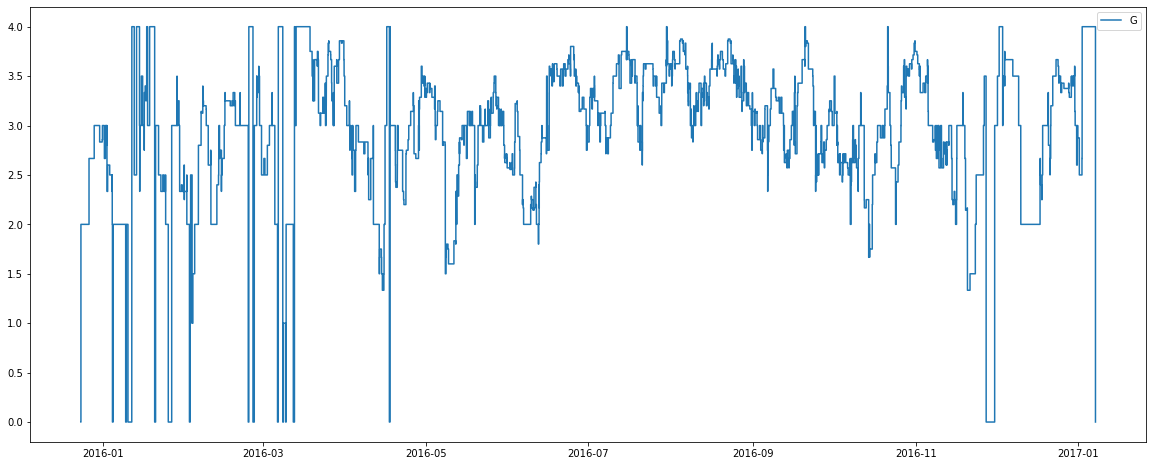
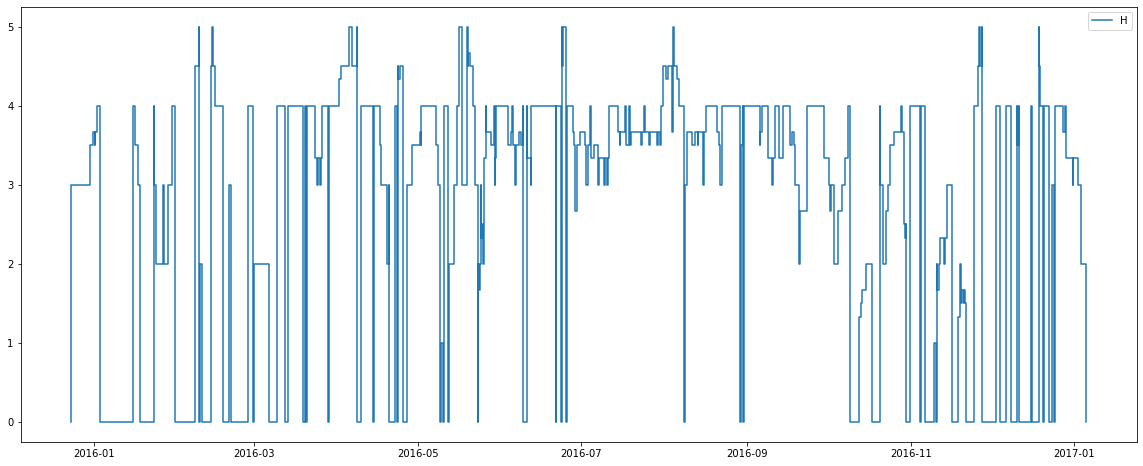
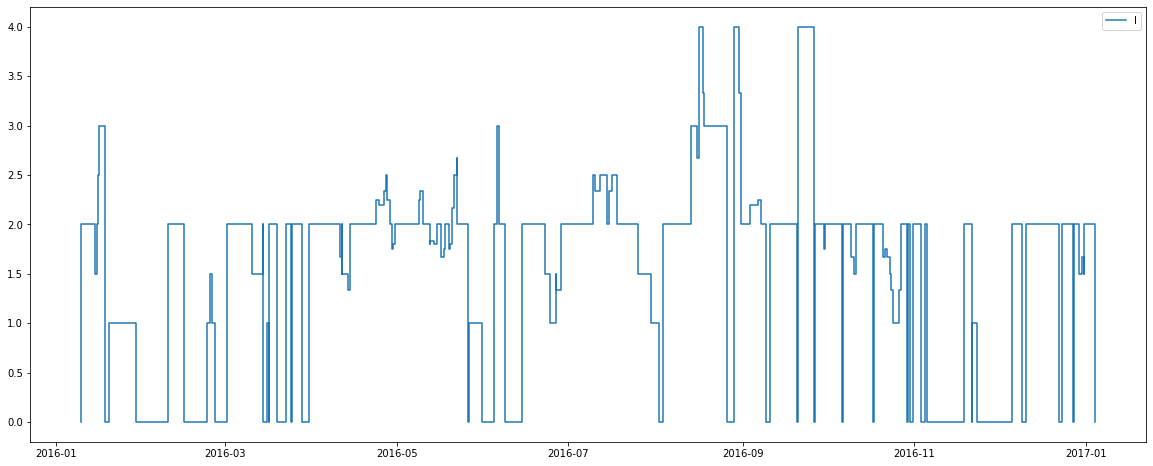
There are some interesting observations from the above graphs:
1) The nature of the plot for room type C changes around April.  When we cross reference it with the assigned room count plot we see that the total number of rooms of type C seems to increase around April.  Perhaps the hotel finished renovations which increased the number of rooms of this type?

2) Room types C, G, H and I are capable of holding 4+ people.  Recall from previous plots there is also a seemingly low number of these rooms available.  Perhaps types C, G, H and I are in fact different bed configurations for the one pool of rooms?  Perhaps the purchase of more beds (allowing more possible configurations) was the cause of more rooms of type C being available from April onwards?

3) Room types B and F generally hold 2 people.  There is also a relatively low number of these room types?  Perhaps these room types are good candidates for being a penthouse suite, or some similar luxury room?

4) The average number of people per room appears to slightly increase in July and August for many room types?  Perhaps this hotel belongs to an area of the world which holidays over these months, making rooms more likely to be booked by families with children?
How often were people upgraded from room type A to room type B?
So far the analysis has focussed on assigned rooms. The original data also contains information on what type of room was reserved. Let’s start by creating Stairs instances for each reserved room type. We’ll also check what types of room can be reserved.
[20]:
reserved_room_type_stairs = data.groupby(["reserved_room_type"]).apply(lambda df: sc.Stairs(use_dates=True).layer(df.check_in, df.check_out))
reserved_room_types = list(reserved_room_type_stairs.index)
reserved_room_types
[20]:
['A', 'C', 'D', 'E', 'F', 'G', 'H']
It is interesting to note that room types B and I cannot be reserved. We speculated above that rooms of type B might luxury - perhaps they are a type of Presedential Suite that is cannot be reserved! As for room I, perhaps it corresponds to a configuration which includes 1 double bed and 2 single beds put together to form a double? This would explain why it is not a reservable type - presumably guests would just book a room type with two double beds.
For those room types which can be reserved, let’s see how often guests are assigned the room they requested by taking the difference of two pandas.Series holding Stairs instances.
[21]:
reserved_vs_assigned_stairs = reserved_room_type_stairs - assigned_room_type_stairs[reserved_room_type_stairs.index]
reserved_vs_assigned_stairs
[21]:
reserved_room_type
A    <staircase.Stairs, id=139784279282016, dates=T...
C    <staircase.Stairs, id=139784282090896, dates=T...
D    <staircase.Stairs, id=139784275368496, dates=T...
E    <staircase.Stairs, id=139784275462416, dates=T...
F    <staircase.Stairs, id=139784283891408, dates=T...
G    <staircase.Stairs, id=139784272362656, dates=T...
H    <staircase.Stairs, id=139784275616000, dates=T...
dtype: object
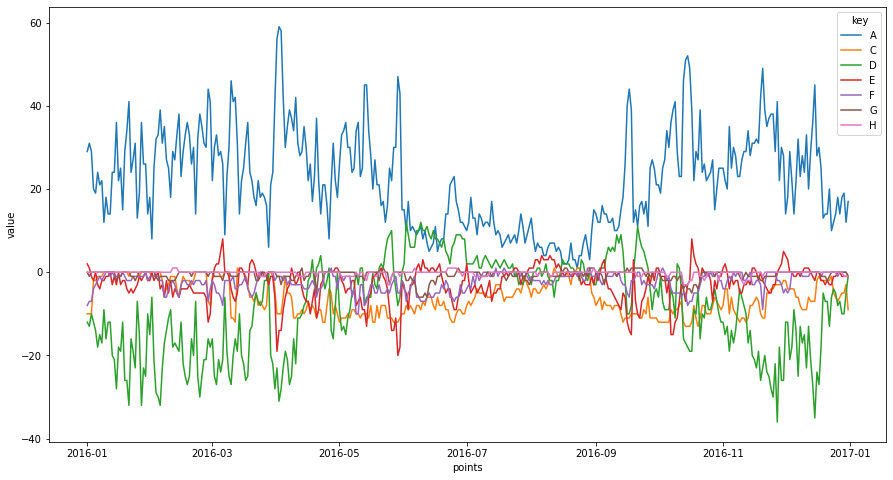
We plot these step functions below. Note that room type A is requested more often than it is assigned, and room D is, more often than not, assigned more than it is requested. Both of these room types generally hold 2 guests so we speculate that room type A is a budget room, and when all rooms of this type are occupied, guests are upgraded to a more premium room of type D. It also appears that when rooms of type D are popular (May to October based off the chart), guests requesting room A might be upgraded to rooms of type C - which can hold more than 2 people but of course can still be used to accommodate 2 (or less people) if required.
[22]:
fig, ax = plt.subplots(figsize=(15,8))
sns.lineplot(data=sc.sample(reserved_vs_assigned_stairs, midnights_2016), x="points", y="value", hue="key", ax=ax);
[22]:
<AxesSubplot:xlabel='points', ylabel='value'>
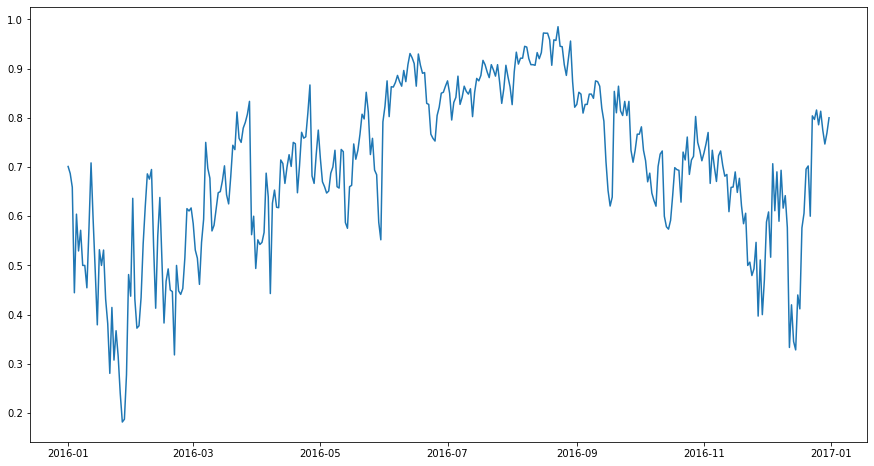
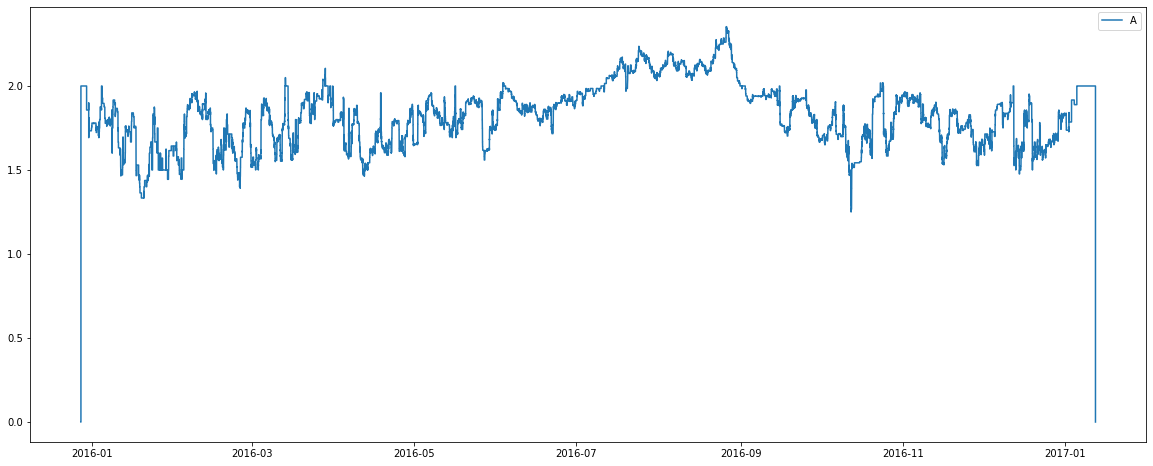
What percentage of bookings for room type A are upgraded (assuming that is what is happening) over time? The plot below shows the fraction of bookings for room type A that were assigned room type A. It is interesting to note that from June to September a relatively high proportion of bookings requesting room type A are assigned these rooms. Yet we have seen that the total number of guests is relatively high during this time. This gives credence to our previous speculation that families are with 3+ people are booking at a higher rate over this period
[23]:
reserved_vs_assigned_frac = assigned_room_type_stairs[reserved_room_type_stairs.index]/(reserved_room_type_stairs + sc.Stairs(0.0001, use_dates=True))
fig, ax = plt.subplots(figsize=(15,8))
ax.plot(midnights_2016, reserved_vs_assigned_frac['A'](midnights_2016));
/home/docs/checkouts/readthedocs.org/user_builds/railing/envs/v1.6.4/lib/python3.8/site-packages/ipykernel/ipkernel.py:283: DeprecationWarning: `should_run_async` will not call `transform_cell` automatically in the future. Please pass the result to `transformed_cell` argument and any exception that happen during thetransform in `preprocessing_exc_tuple` in IPython 7.17 and above.
  and should_run_async(code)
[23]:
[<matplotlib.lines.Line2D at 0x7f220c3c3f40>]